Integration and automation
This is the No.1 letter shared with Columns Flow builders.
The Problem People are often intimidated by data, even though they want visual insights. Traditionally, turning raw data into polished, personalized visuals requires many engineers and analysts. Building a repeatable workflow around that process is even more expensive.
This creates a major barrier for business leaders who do not have time to get "under the hood" of complex tools.
The Opportunity We have entered the AI era. No matter how you feel about it, AI is highly effective at technical execution, including coding.
This unlocks a major opportunity to work with data more confidently. It lets us move data from chaos to clarity while focusing more on strategy and ideas.
The Focus Columns Flow is not another spreadsheet tool. You already have many options for editing and ad hoc analysis.
We focus on Integration & Automation. No matter where your data lives, such as spreadsheets, Airtable, Notion, SQL databases, or APIs, you can route it into a flow to produce the output you need: charts, web reports, email notifications, Slack messages, or customer-facing widgets.
I hope this clarifies the vision behind Columns Flow. I am looking forward to your feedback.
To help you have a successful first experience, here is a quick breakdown of the core concepts:
-
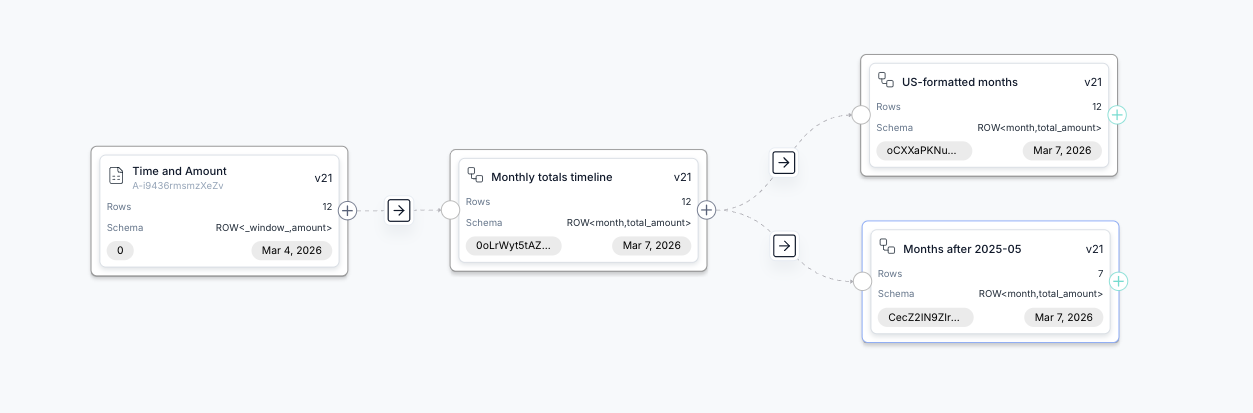
Flow: Defines how data moves and branches across scenarios.
-
Node: A single dataset (shown as a block in the flow).
-
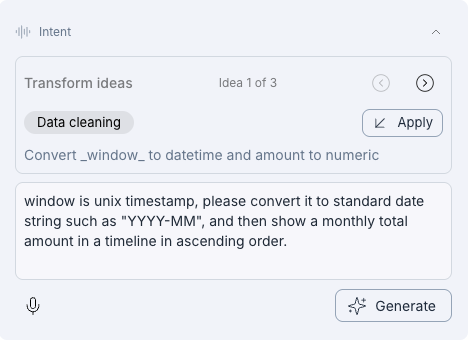
Edge: The logic that transforms one dataset into another (shown as an arrow).
-
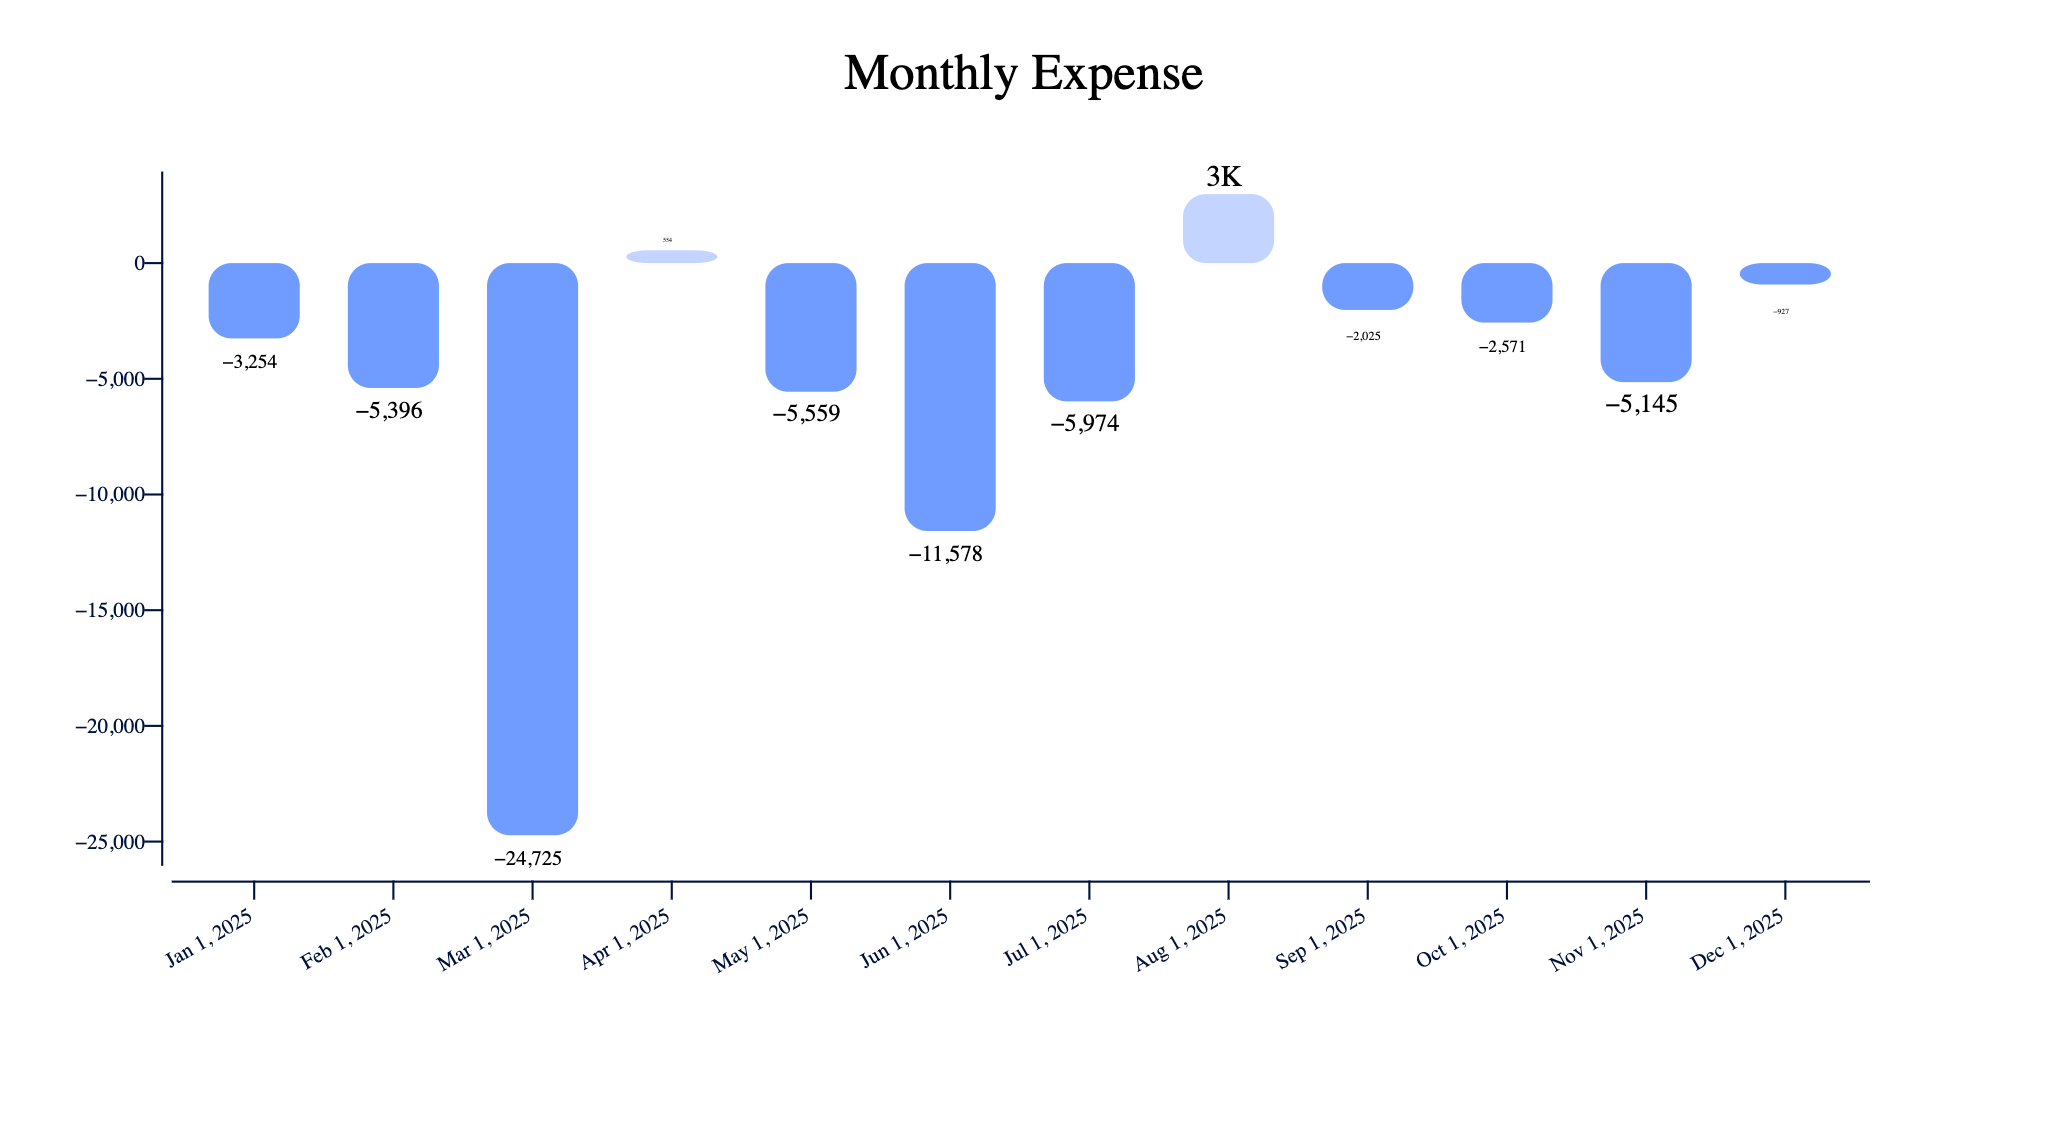
Graph: The chart used to visualize a specific dataset.
-
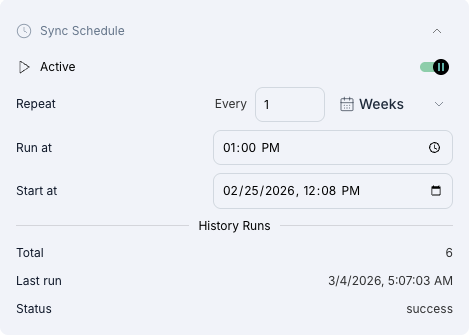
Schedule: Controls how often the flow runs and syncs with connected sources.
-
Summary: A hosted page that summarizes your entire flow for sharing. Example: https://columns.ai/flow/summary/Gxznq56cNUtain
-
Action: A specific task triggered by your data.
Think of it as a simple loop: Data -> Logic -> Action. This framework captures the core of many business data workflows.