Tree
Tree charts visualize hierarchical relationships. Columns supports both radial tree and tree-map layouts.
Requirements
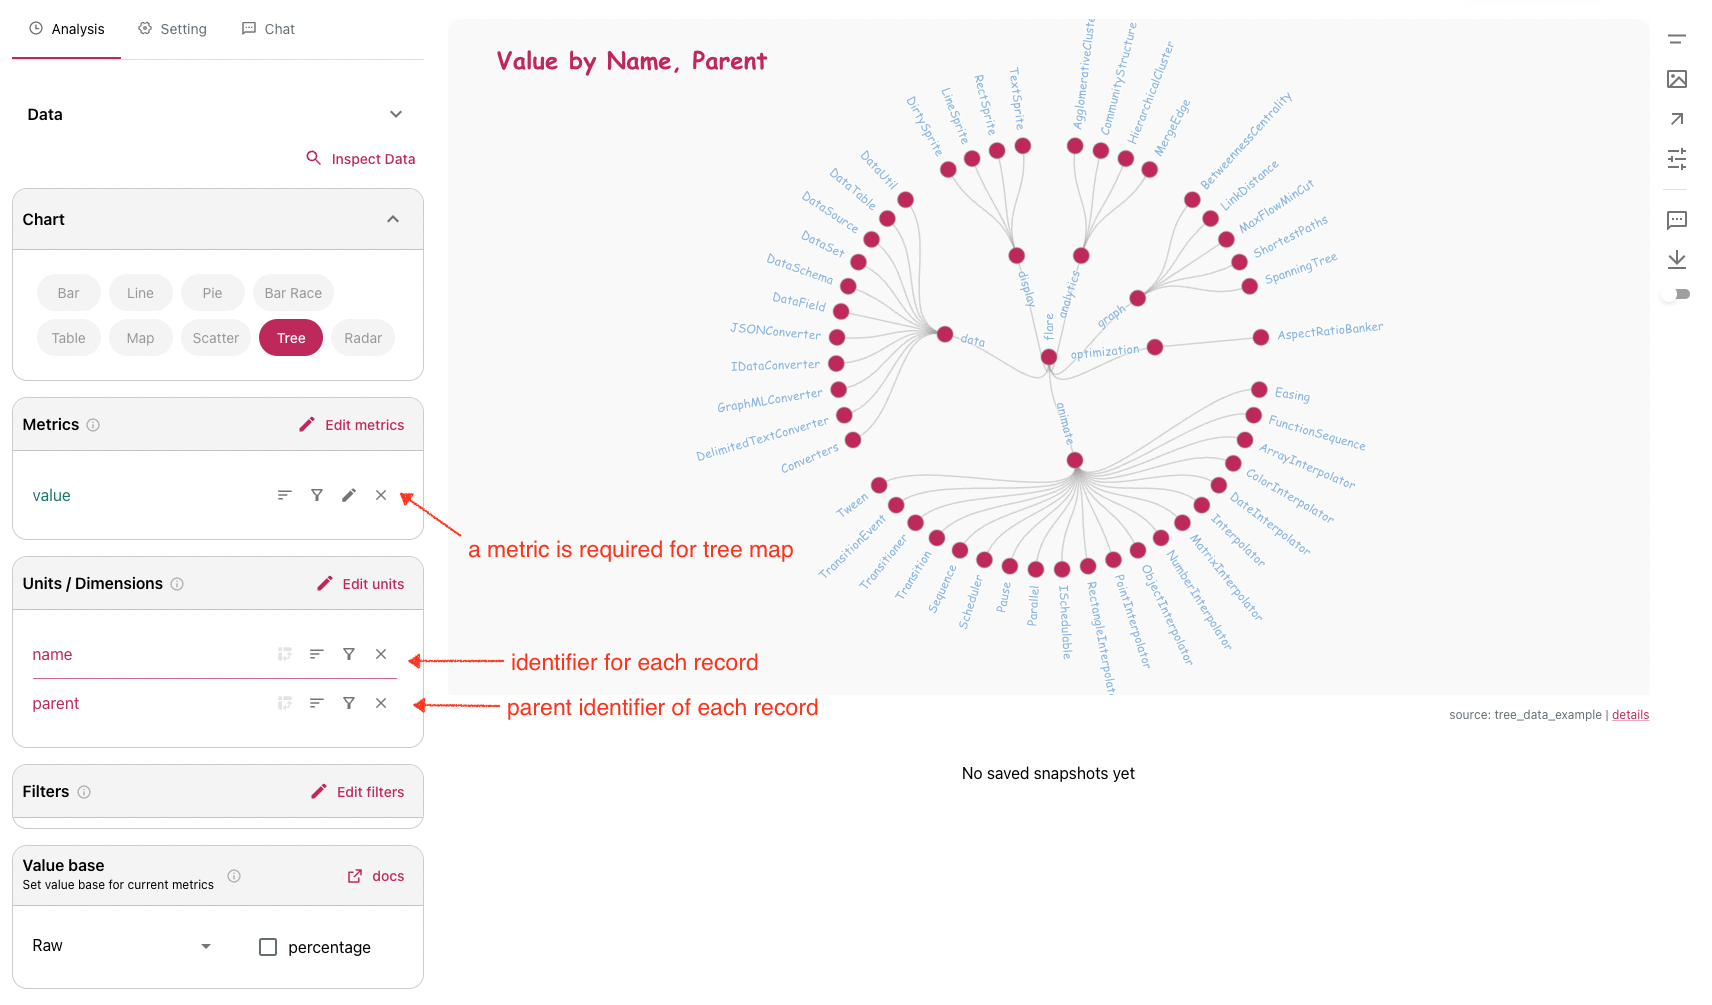
To render a tree, your query should include at least:
id: current node identifierparent: parent node identifier
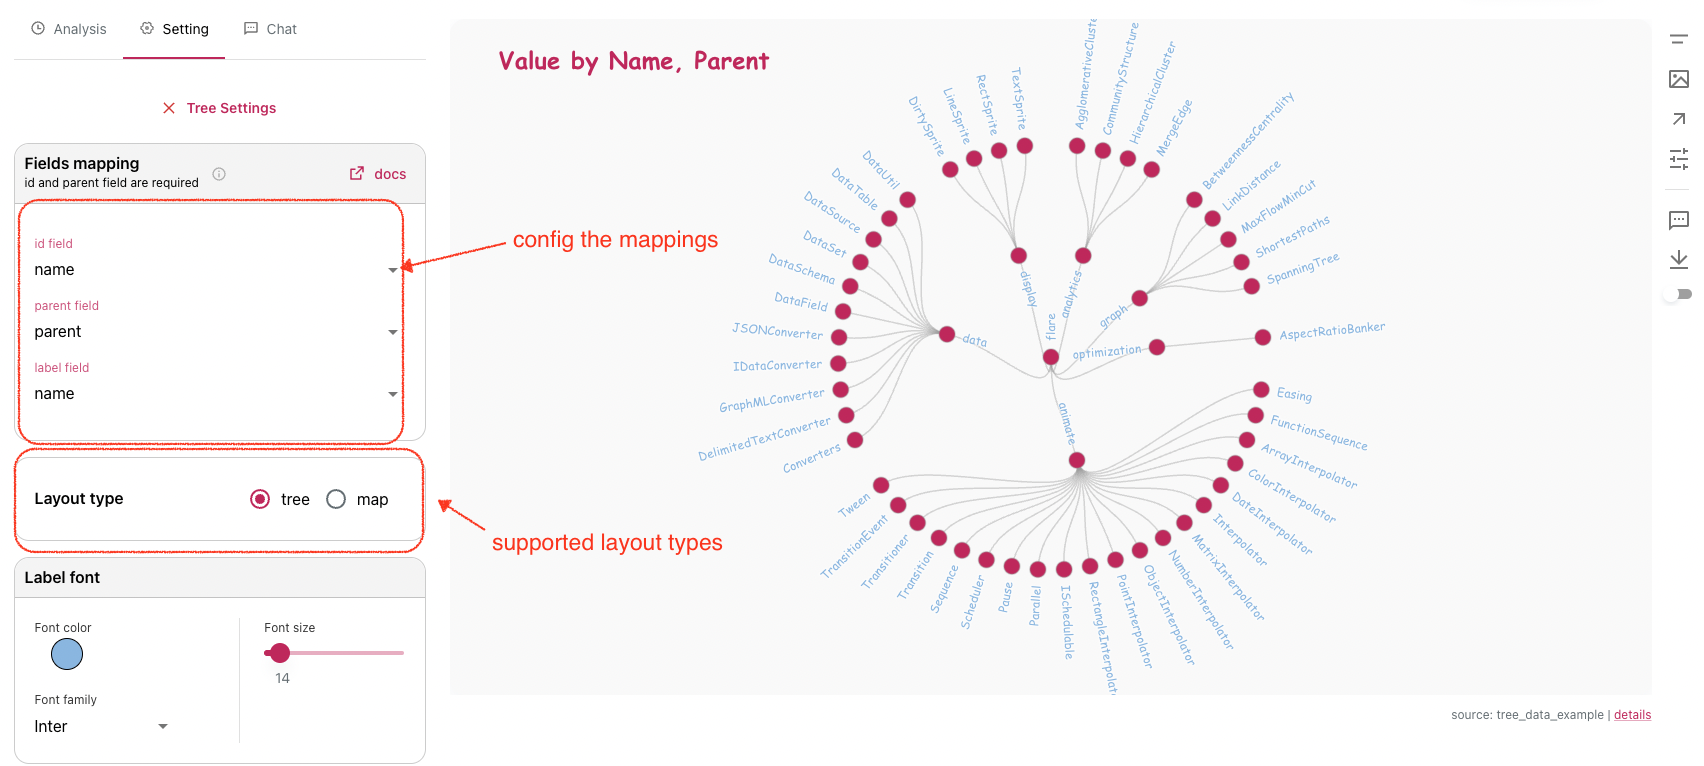
In tree settings, you typically configure:
- id field
- parent field
- label field
Example
Try this example dataset and click Explore and Visualize.
Suggested template:
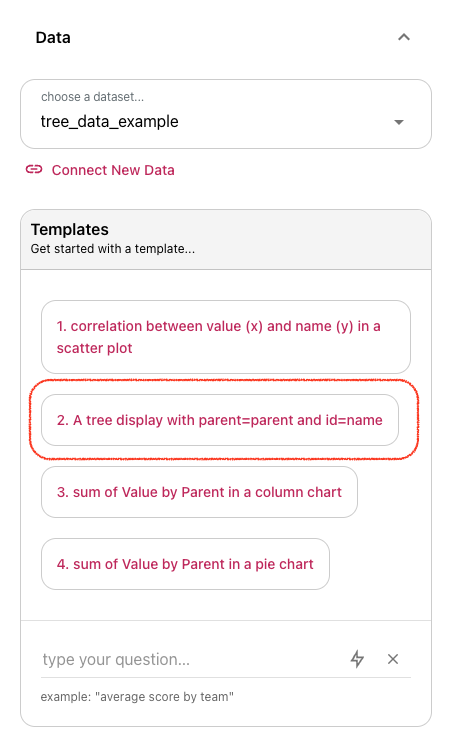
Tree Visual Anatomy
Example query and result:
Tree settings panel:
Color Scale (Tree Map)
In tree-map mode, tile colors can be mapped to metric values.
- With multiple palette stops: quantized coloring
- With two palette stops: linear interpolation