Boxplot
Boxplots summarize distribution using quartiles and extremes.
Required Metric Order
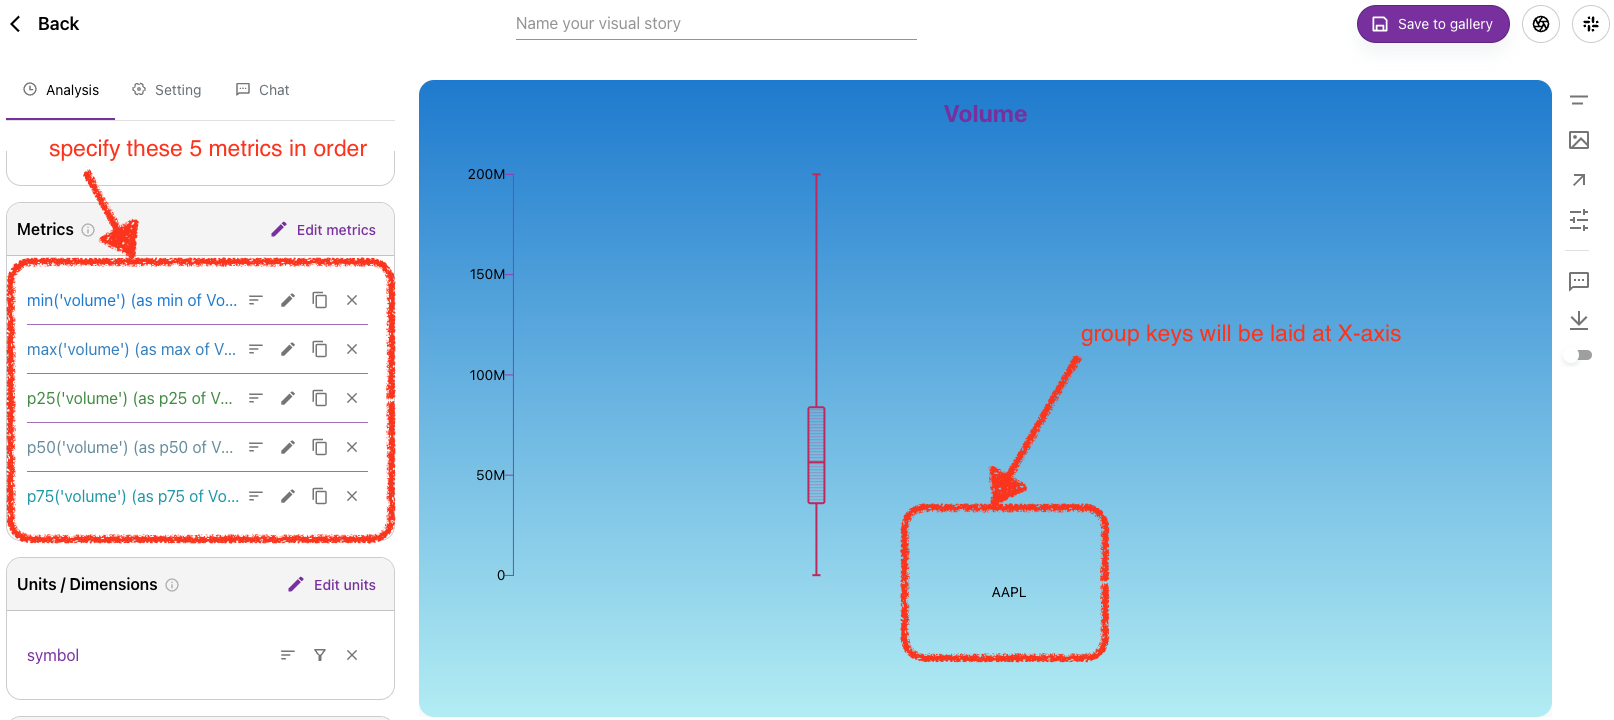
To render a boxplot, provide these five metrics in order:
minmaxp25(Q1)p50(median)p75(Q3)
A wizard for automatic boxplot metric generation is planned. For now, configure these fields manually.
Illustration
You can use keys (for grouped boxplots) or no keys (single distribution view), but the five metrics are always required.
Settings
Current settings are minimal and focused on color. Tooltip styling can be adjusted from general settings.