Radar
Radar charts display one or more metrics on a radial surface, making distribution patterns easy to compare.
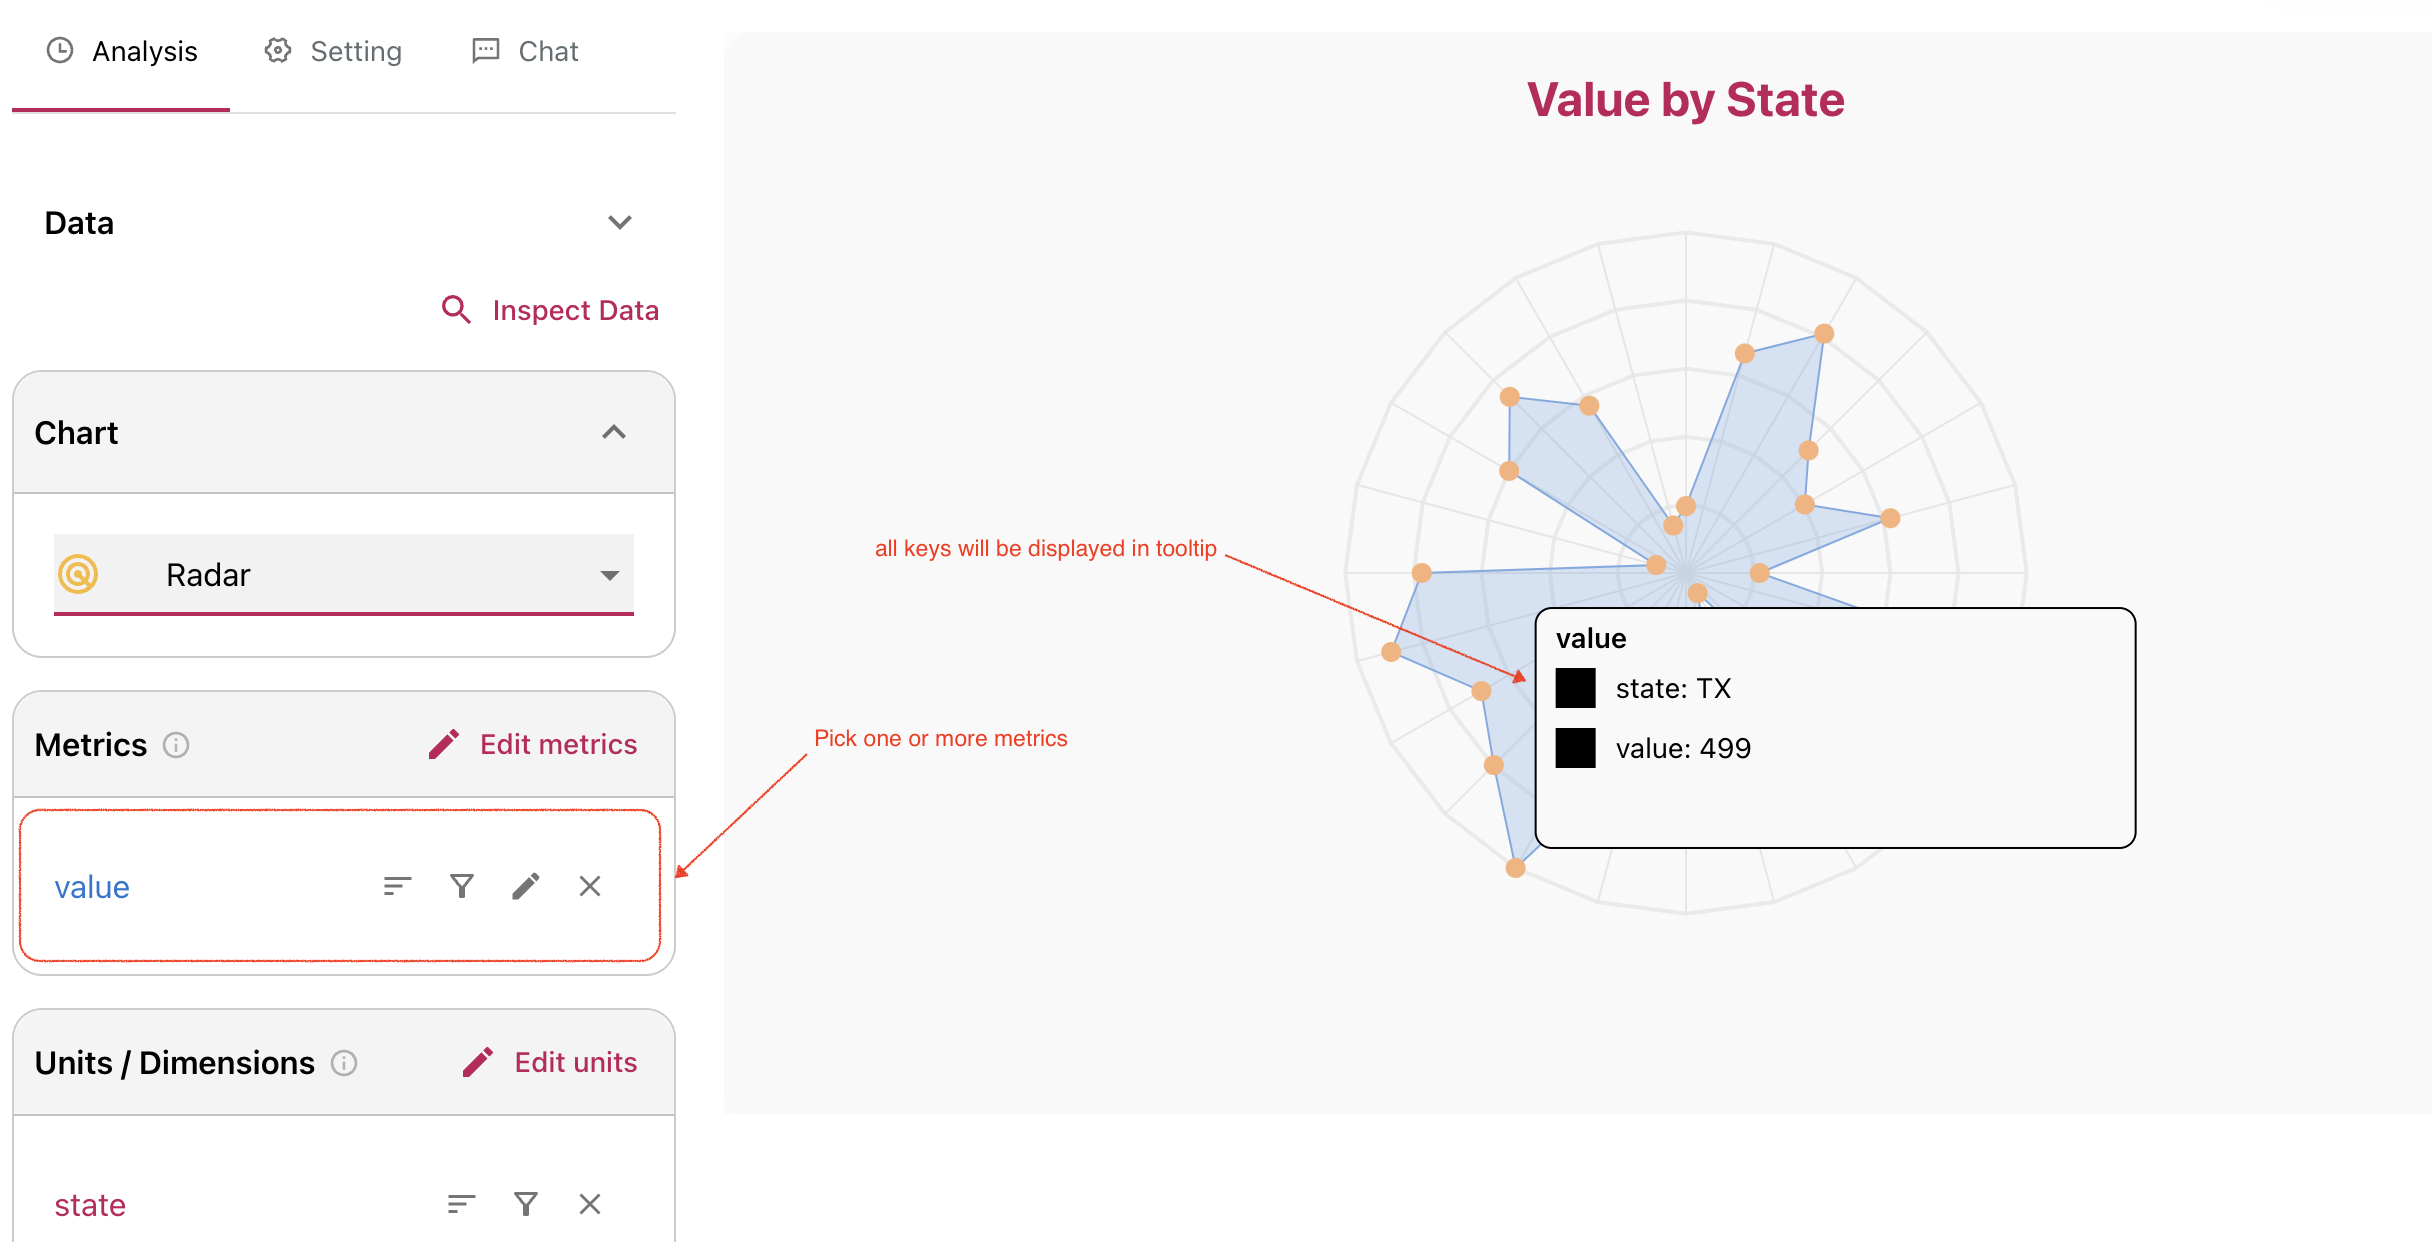
Illustration
Choose one or more metrics and Columns will render the radar view. Dimension values are available in the tooltip for each point.
Settings
Click the chart to open radar settings. You can customize:
- grid color
- point color
- point size