Columns Flow
1. What Columns Flow Is
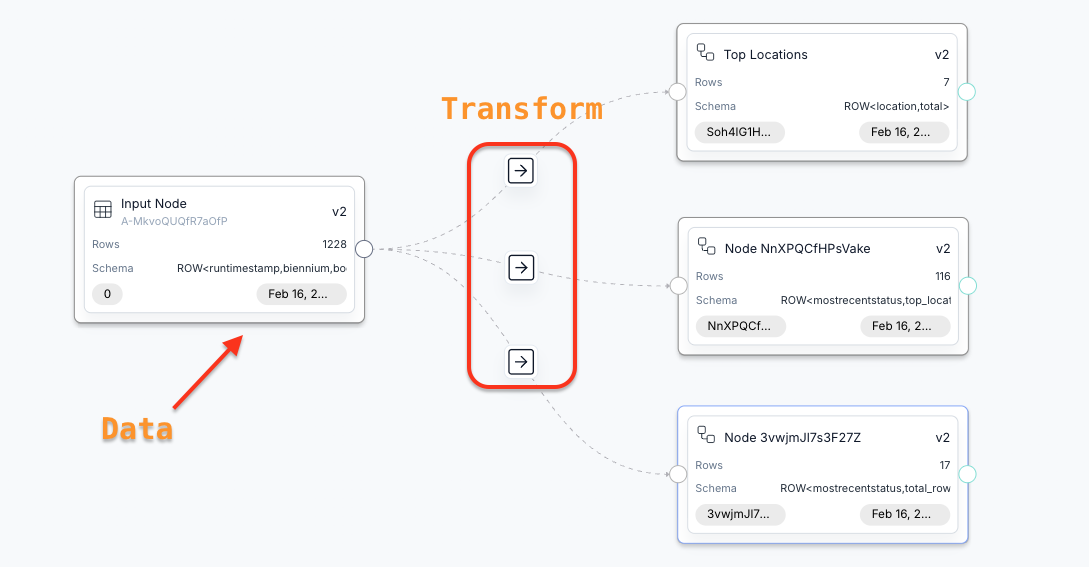
Columns Flow is a visual, node-based workspace for building data workflows in Columns. Each node represents a dataset, and each edge represents a transformation between nodes. You can sync source data, preview outputs, and save visuals from any node.
2. What Columns Flow Can Do
- Connect input nodes to existing data sources and sync them into the flow.
- Transform data with generated compute steps such as transform, aggregate, pivot, post-process, and sort.
- Preview sample inputs and outputs before approving changes.
- Update downstream nodes by approving a transformation on an edge.
- Visualize any node once it has schema and sample data.
3. How You Use Columns Flow
- Create or open a flow and start from the input node.
- Select a data source for the input node, then sync to load schema and data samples.
- Add a new node, connect it from the source node, and open the edge details.
- Describe your transformation intent and click Generate to produce a compute plan.
- Preview the plan and sample output, then click Approve to update the target node.
- Repeat to build multi-step workflows, and visualize any node when needed.
note
Columns Flow includes a built-in starter example. Use it to learn the core workflow quickly.
4. Multi-Source Operations
You can add multiple input nodes and apply multi-source operations:
- Union: Concatenate sources with compatible schema.
- Join: Join two or more datasets on join keys (equivalent to SQL Inner Join).
- Lookup: Keep all rows from the primary source and match rows from others (equivalent to SQL Left Join).
- Except: Keep rows in the primary source that have no match in other sources (equivalent to SQL Anti Join).
5. Intent Examples and Tips
Use these examples as references, then tailor the wording to your own dataset and goal.
- Remove CSV headers:
remove the header row where date equals 'date'. - Convert long date to short date:
convert the date field to month value only, like yyyy-mm format. - Fill missing values:
fill 0 for sales when it is empty. - Pick limited columns:
keep only date, region and sales columns only. - Aggregate and sort:
get total sales by region along a monthly timeline. - Sort and cut:
also sort the result by total sales and leave only the top 10 results for each month. - More examples:
split address into city and state,pivot product categories into columns,filter to the last 90 days,deduplicate by customer id.
tip
Tips for writing intent:
- Use column names exactly as they appear in your schema.
- Be explicit about the output shape (columns, grouping, and time grain).
- State filters, limits, and sorting in the same sentence if possible.
- Call out how to handle missing values or invalid rows.
- Mention any required ordering or top-N behavior.
- Reference other nodes by name when you want to reuse their values.