Map
Maps are one of the fastest ways to explain geographic patterns in your data. In Columns, map rendering is automatic once a valid location field is detected.
Supported Maps
Columns currently supports:
- Japan map: prefecture and city levels
- US map: state, county, and ZIP/city levels
- World map: country level
- Europe map: country level
Available rendering styles:
SpikeBubbleChoropleth
Location Matching
Columns checks your key fields and matches them to known geographic identifiers.
US Map
Supported identifiers include:
- State name (for example
Washington) - State code (for example
WA) - ZIP code (5-digit, for example
98033) - City name
- County name
- County FIPS (5-digit)
- County FIPS (3-digit)
Reference files:
If you use FIPS codes, keep them as text to preserve leading zeros (for example 015).
Japan Map
Supported identifiers include:
- Prefecture name (English or Japanese)
- City name (English or Japanese)
Reference files:
Europe Map
Supported identifiers include:
- Country name
- ISO2 code (
DE,FR,CZ) - ISO3 code (
DEU,FRA,CZE) - UN numeric code (3-digit)
- Common aliases (
UK,Russia, etc.)
Reference file:
World Map
Supported identifiers include:
- Country name
- Country code (for example
USA,CHN)
Reference file:
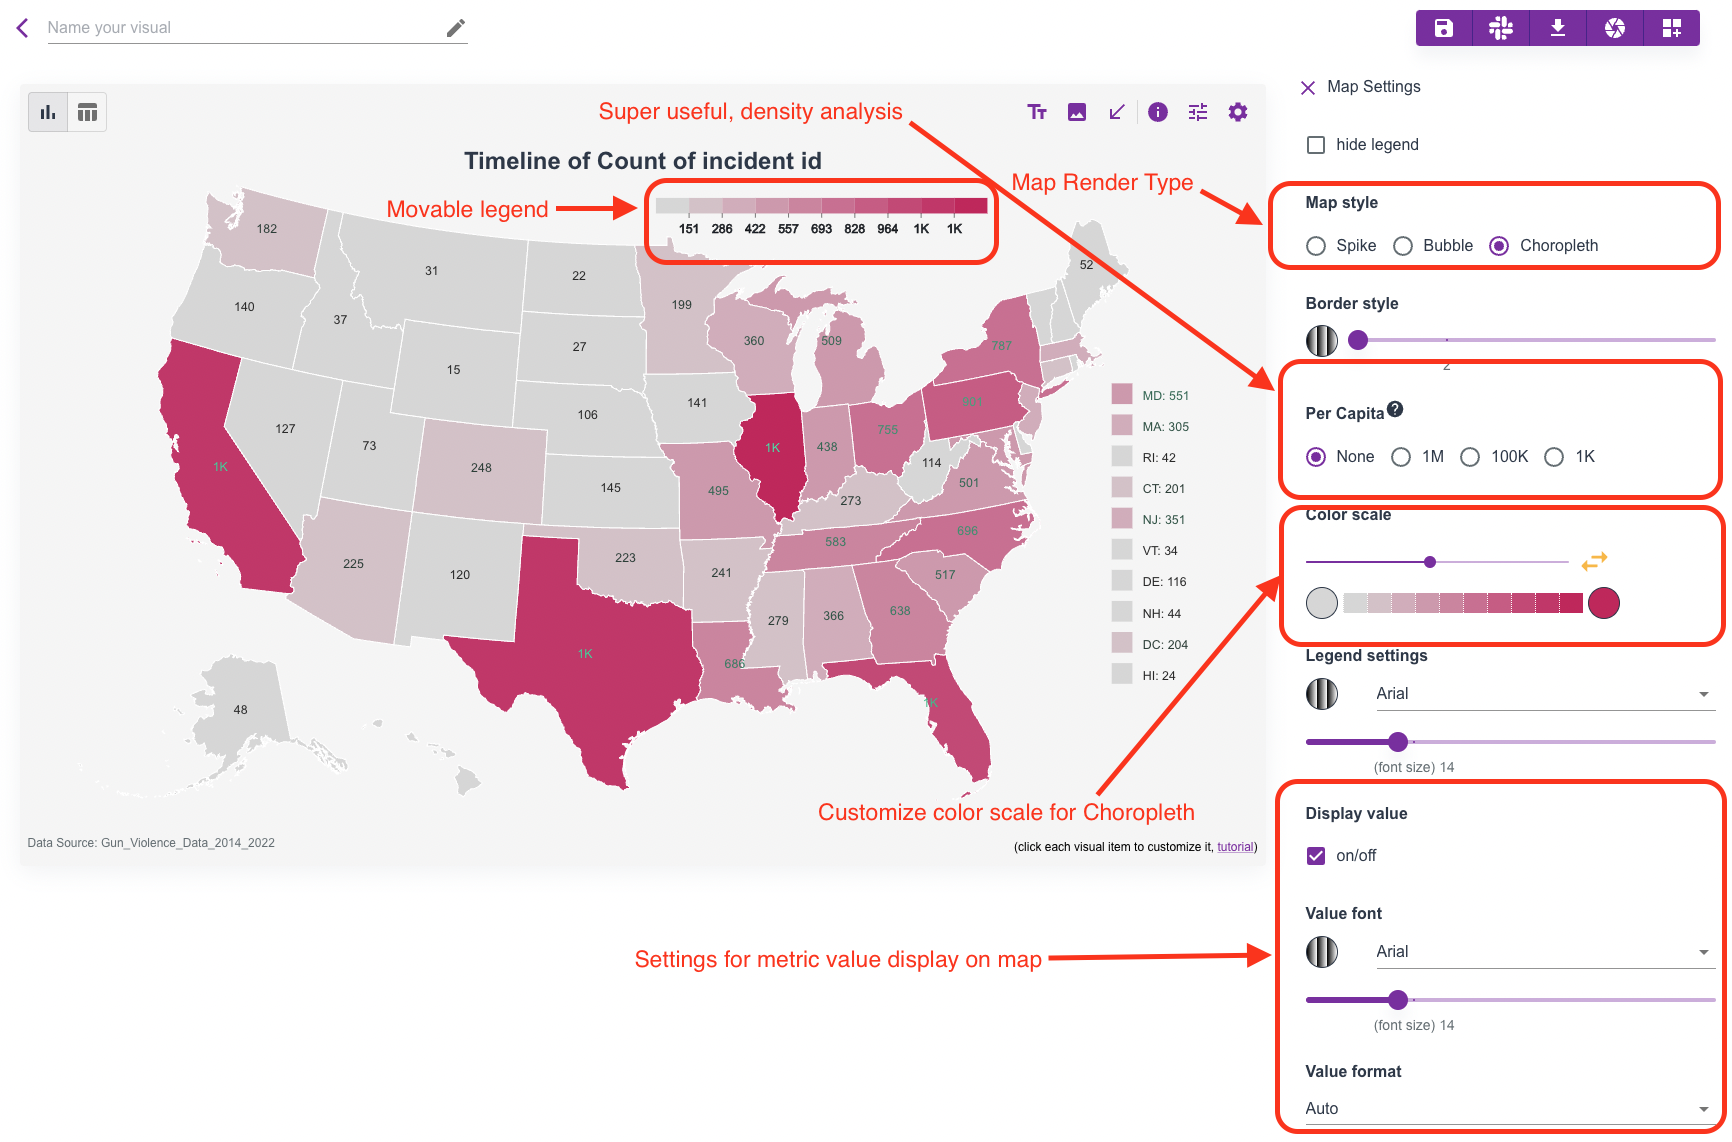
Map Settings
When you click the map canvas, the map settings panel opens on the right.
Example of automatic state-level rendering:
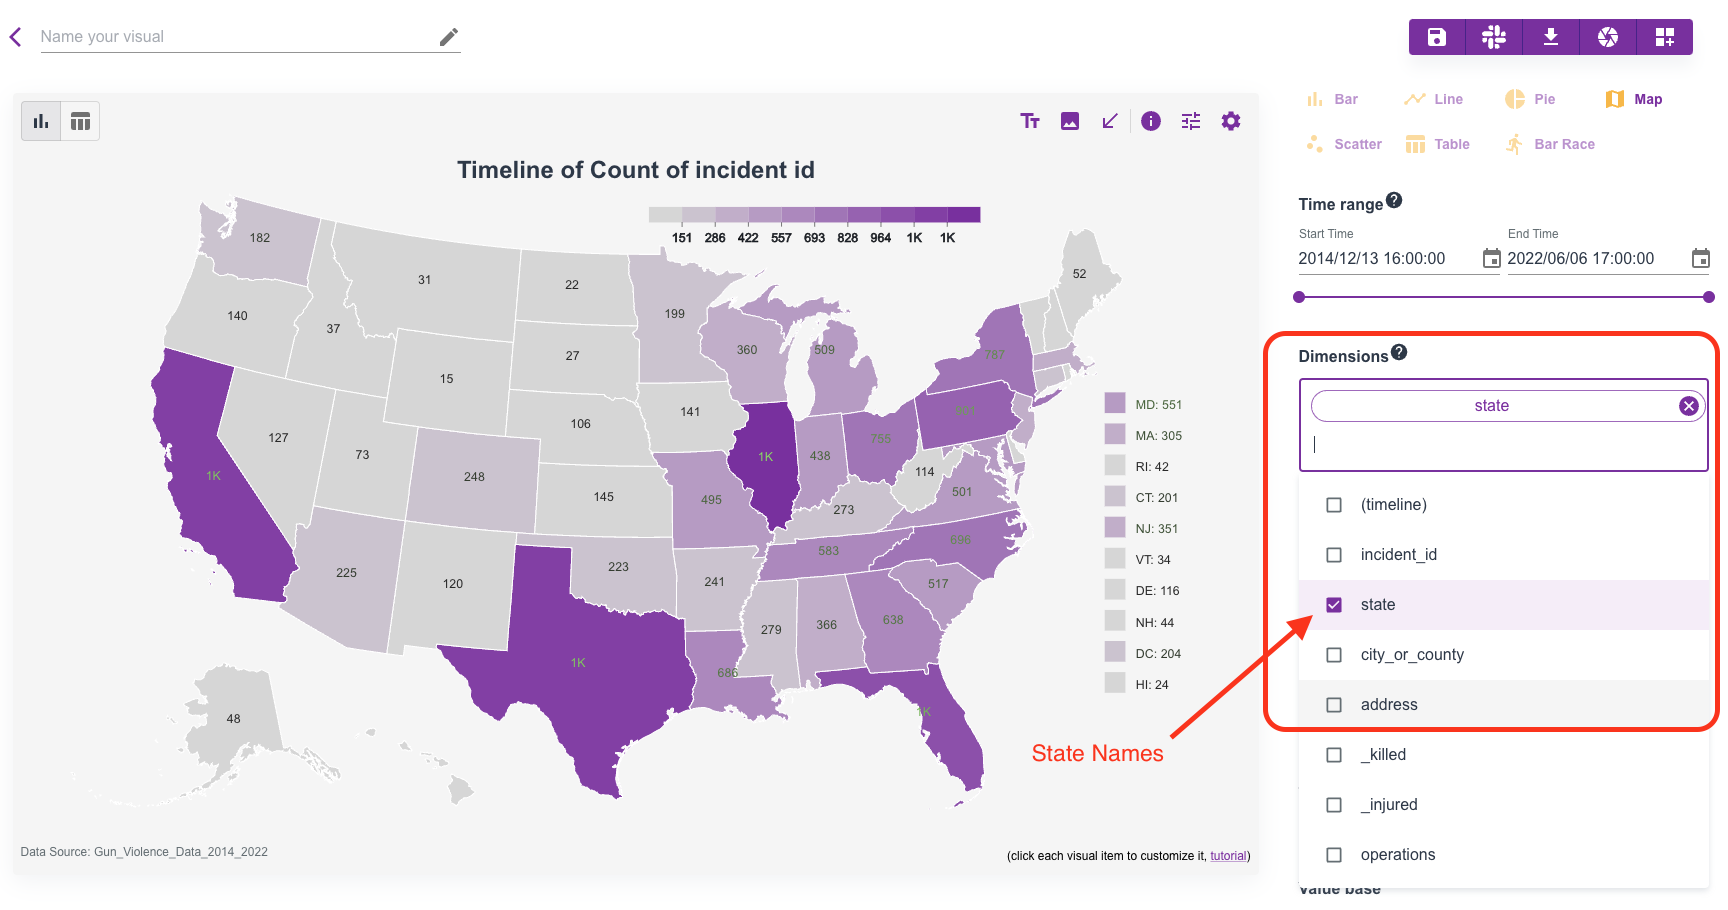
Map settings panel:
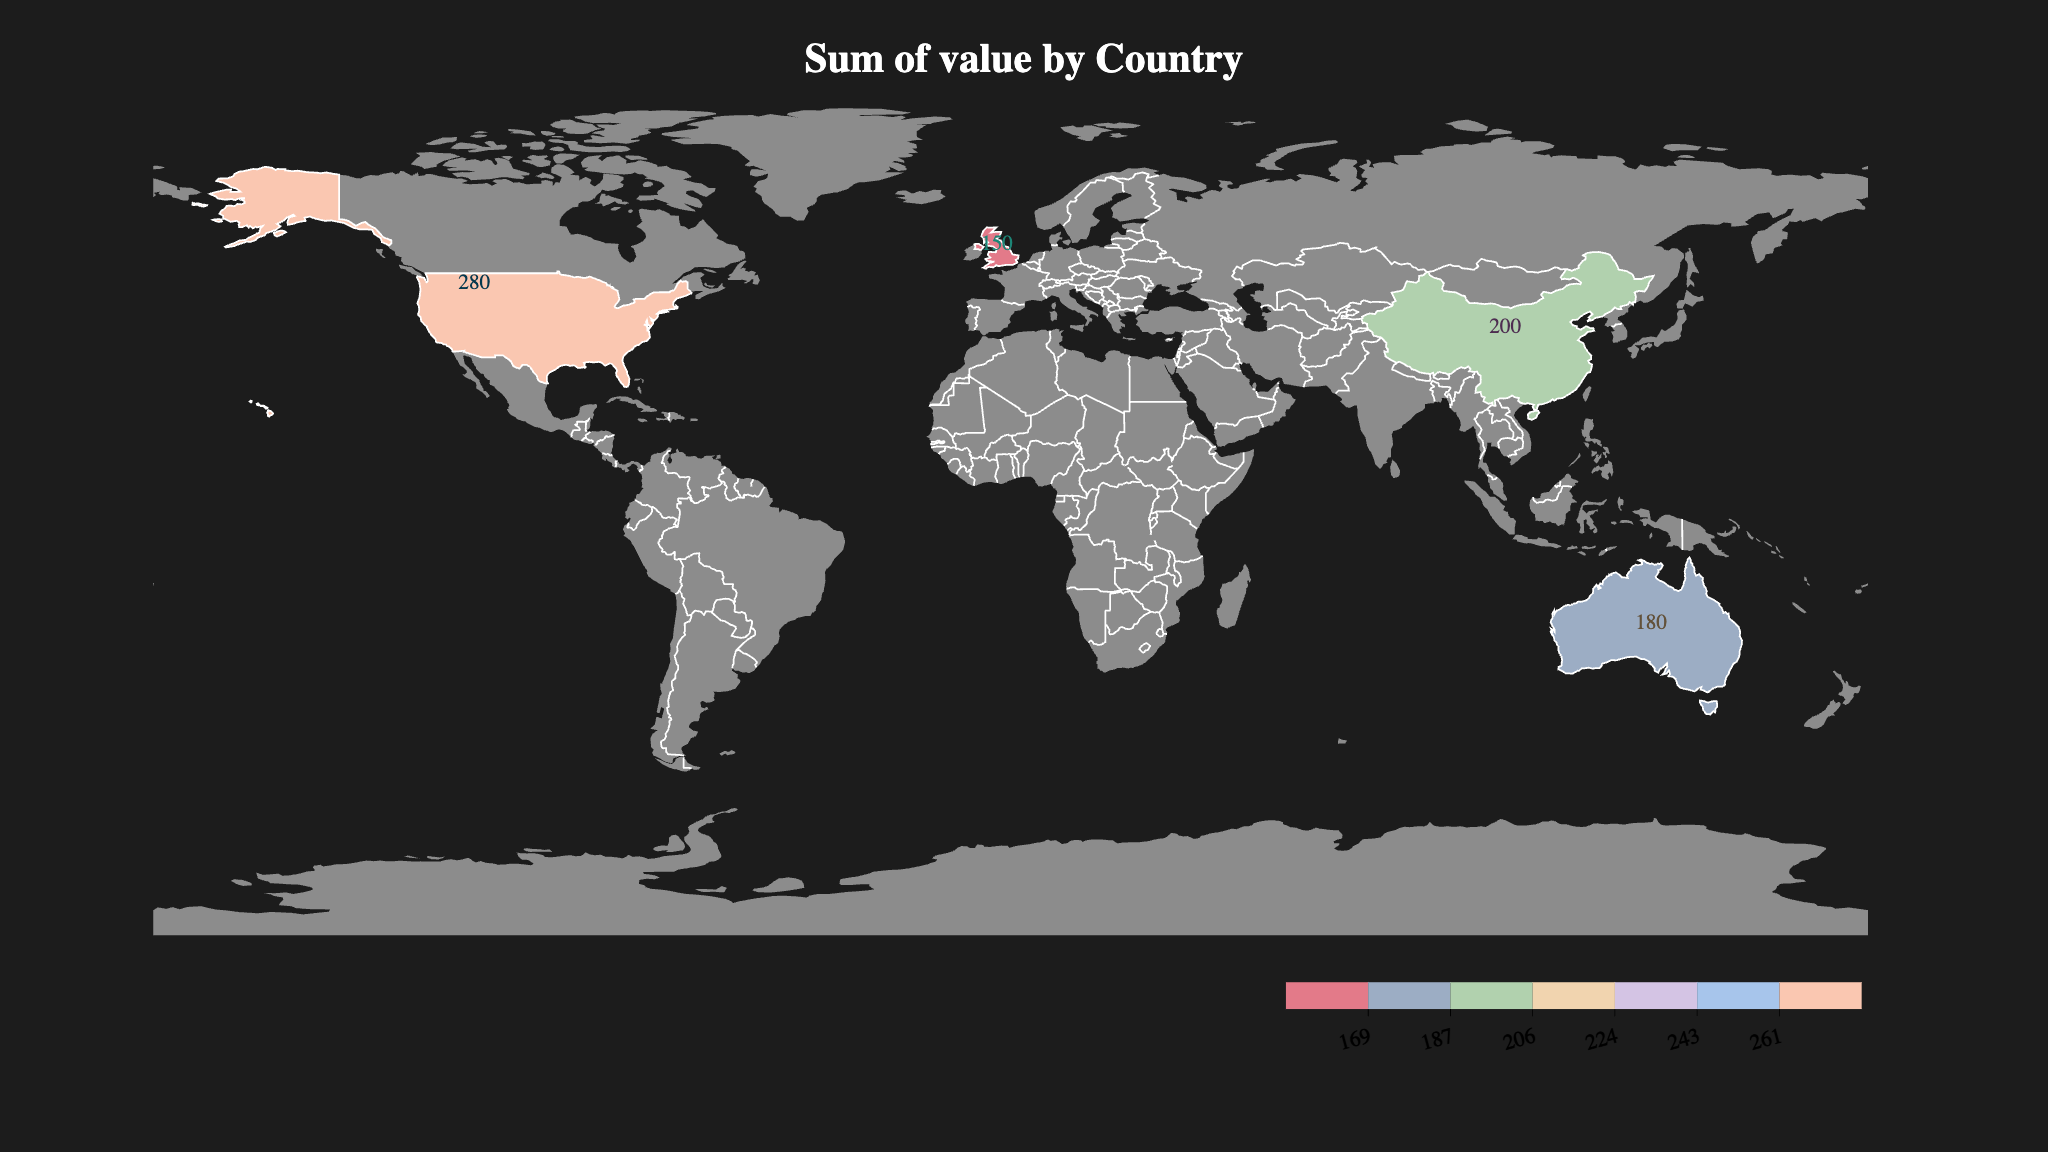
World map example:
Data example
Per-Capita Analysis
For US maps, you can normalize values by population using built-in per-capita options:
- per
1M - per
100K - per
1K
This is useful when density is more meaningful than raw totals.
More Examples
You can find community map stories on the Discover page.