Timeline
Timeline charts are designed for time-series analysis. Columns includes timeline-specific capabilities such as windowing and forecasting.
Timeline Features
- Flexible time-window controls
- Continuous and bounded time aggregation
- Forecasting for selected metrics
Timeline features are available only for datasets with a configured time column.
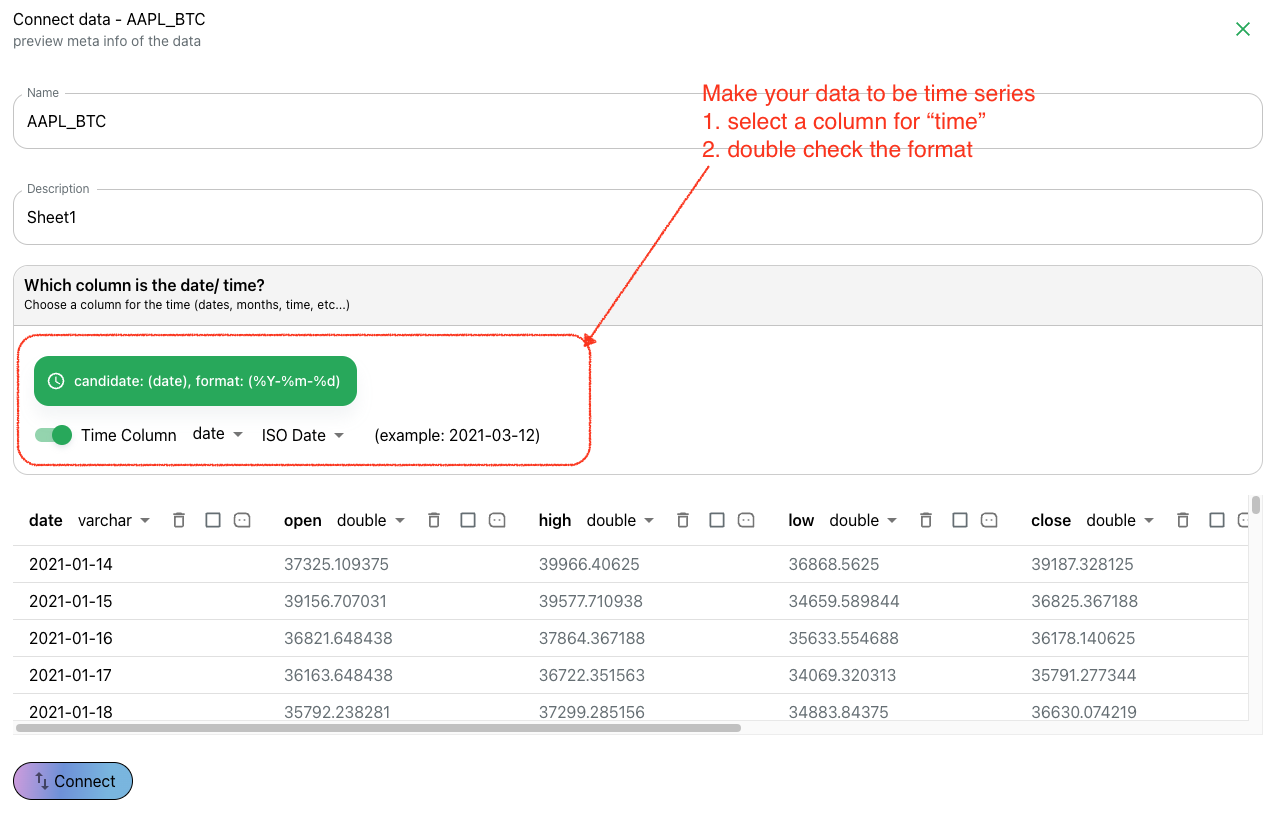
Enable Time Series
When creating a data connection, enable time series and specify:
- the time column
- the time format pattern
Build Timeline Views
For time-series datasets, Columns can generate timeline queries by default. You can then adjust:
- time range
- aggregation unit (day, week, month, quarter, year)
- missing-value behavior
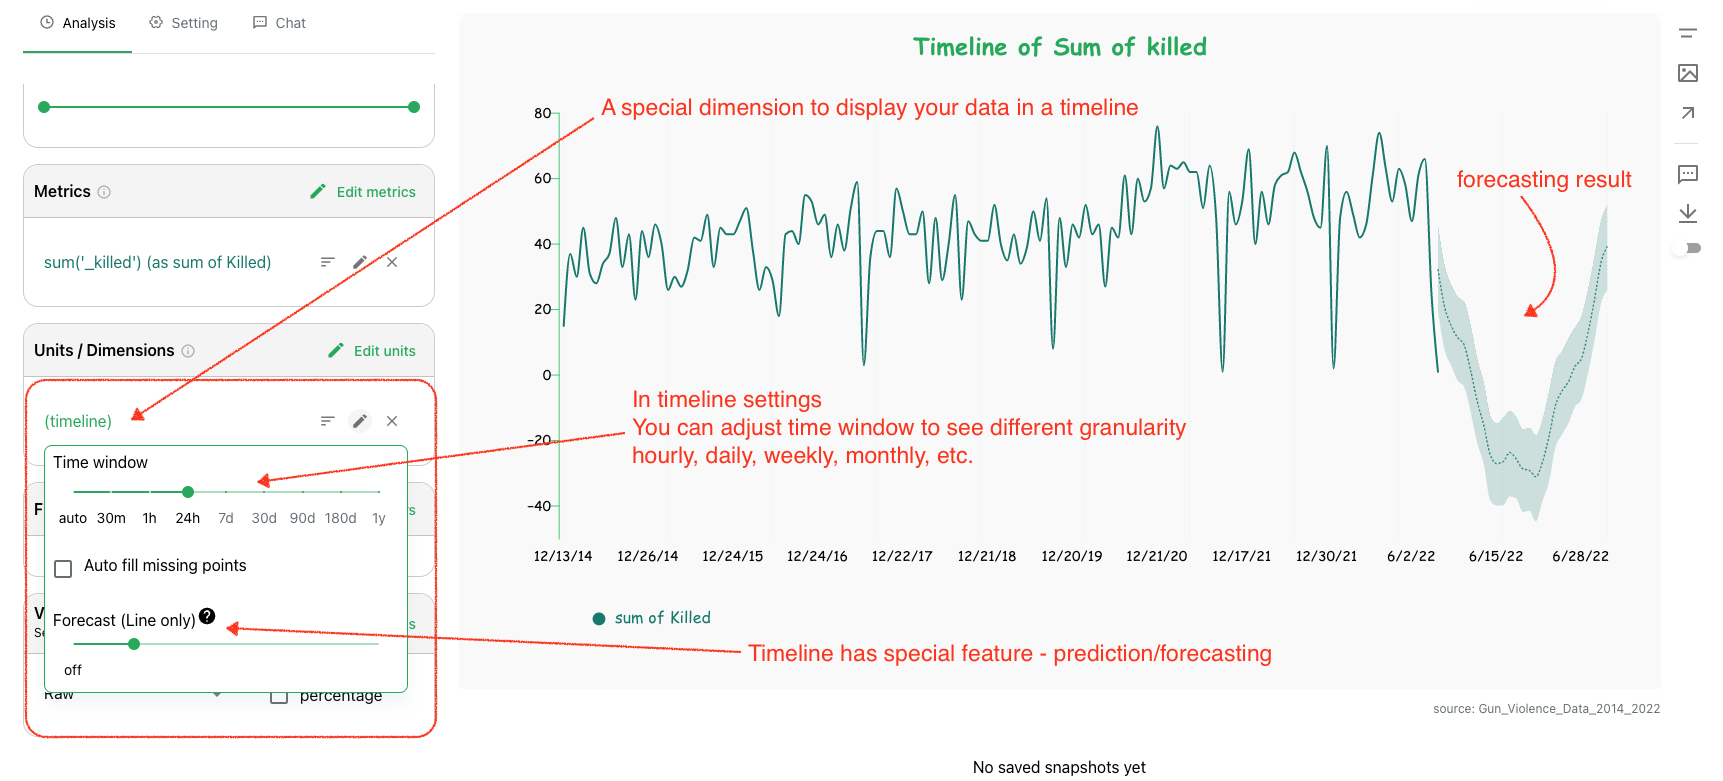
Forecast
Forecasting is available for timeline charts. You can set a forecast percentage to project future values from historical points.
Forecasted values are displayed with a bounded confidence range.
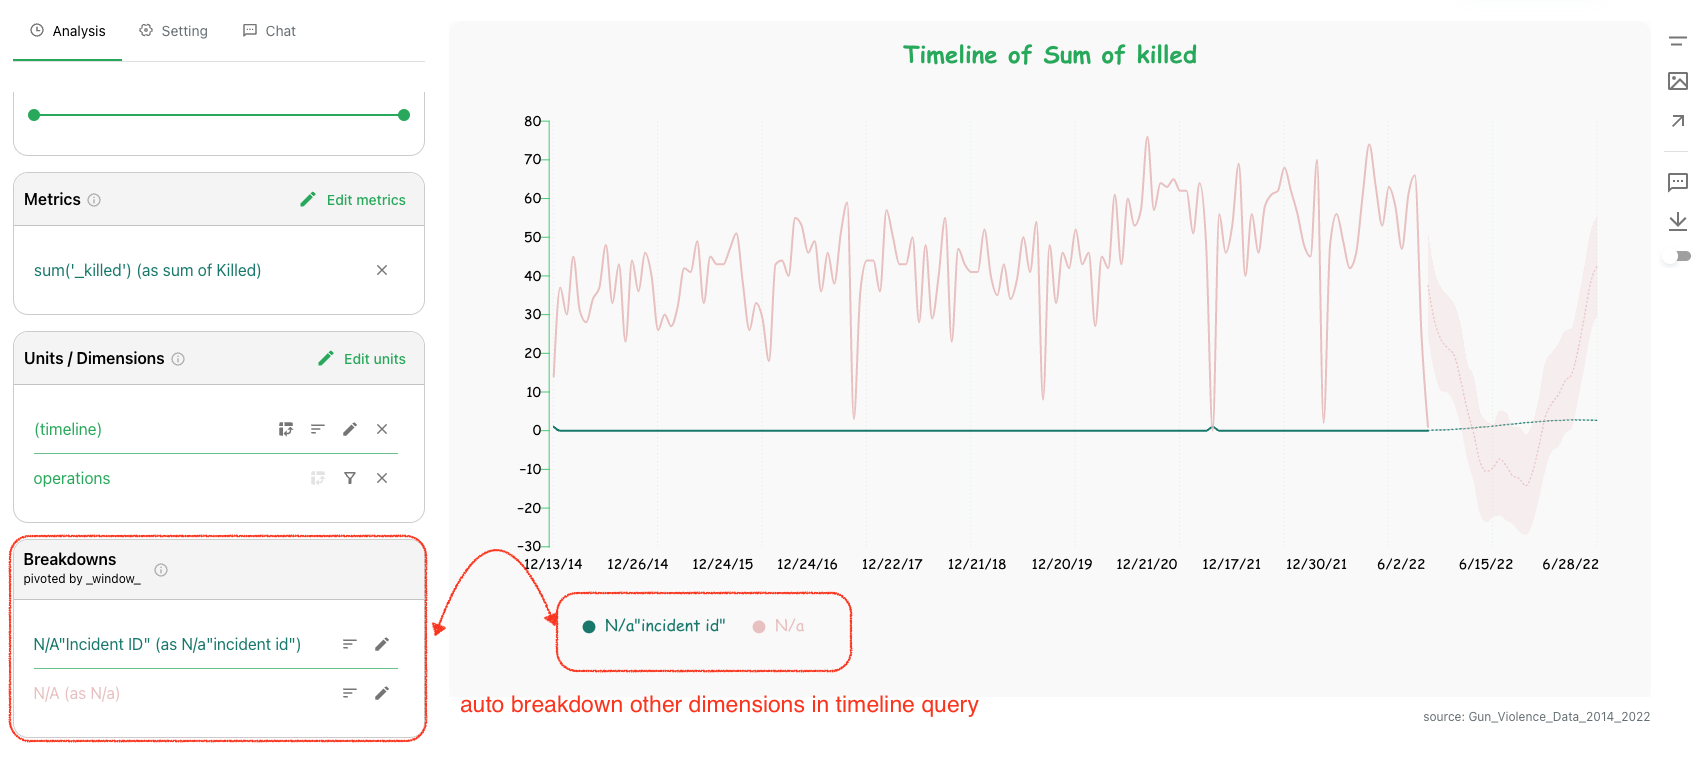
Auto Breakdown for Multiple Dimensions
When multiple dimensions are used in a timeline query, Columns automatically treats the timeline field as the pivot axis and uses other dimensions as breakdown fields.