Scatter
Scatter charts are ideal for showing relationships between metrics. They can also be used as bubble charts.
Columns also supports bubble rendering in map charts.
Metric Mapping Order
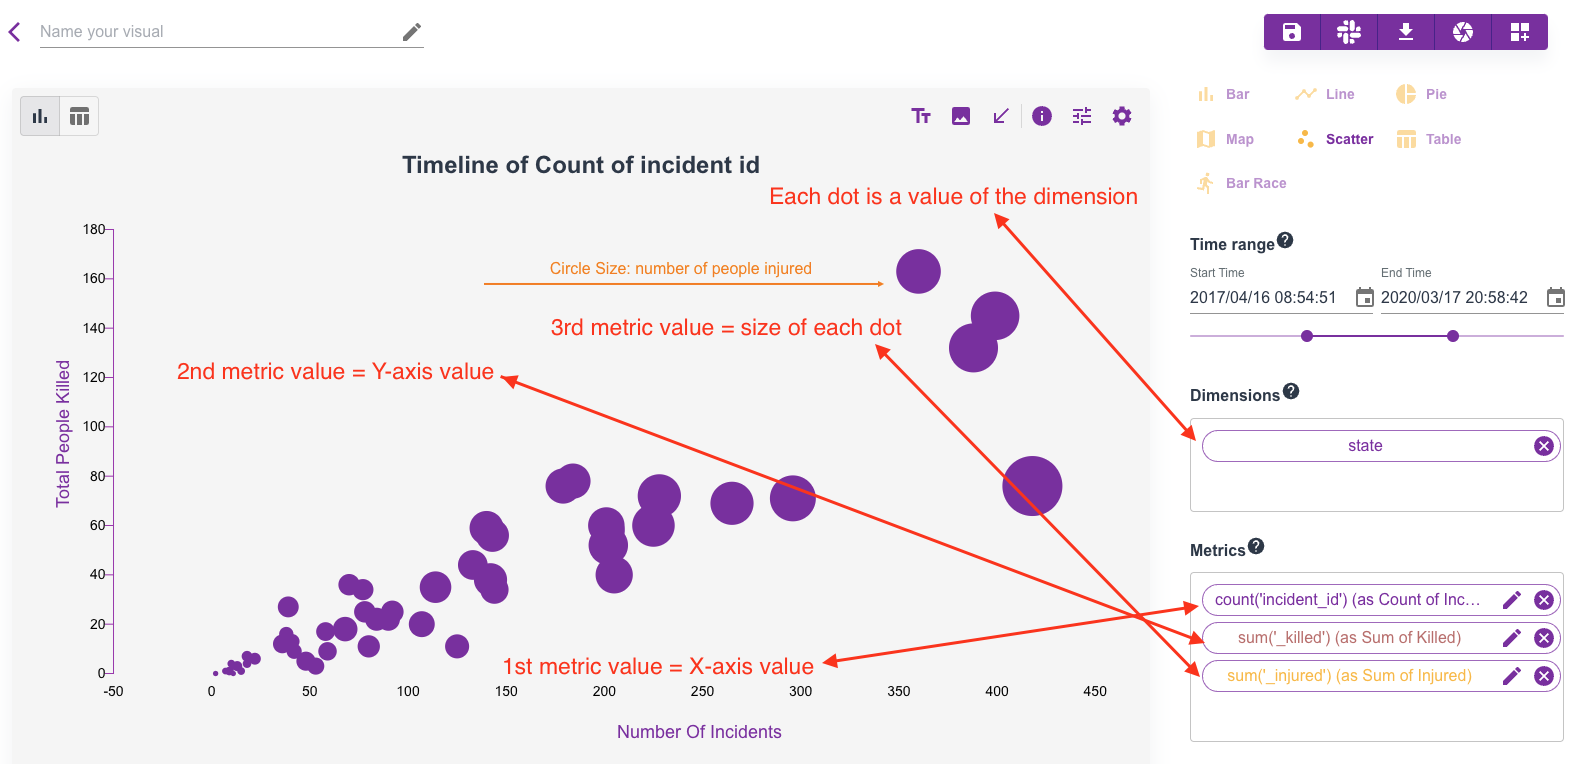
Scatter supports up to four metrics. Order matters:
- Metric 1 → X-axis
- Metric 2 → Y-axis
- Metric 3 (optional) → bubble size
- Metric 4 (optional) → bubble color
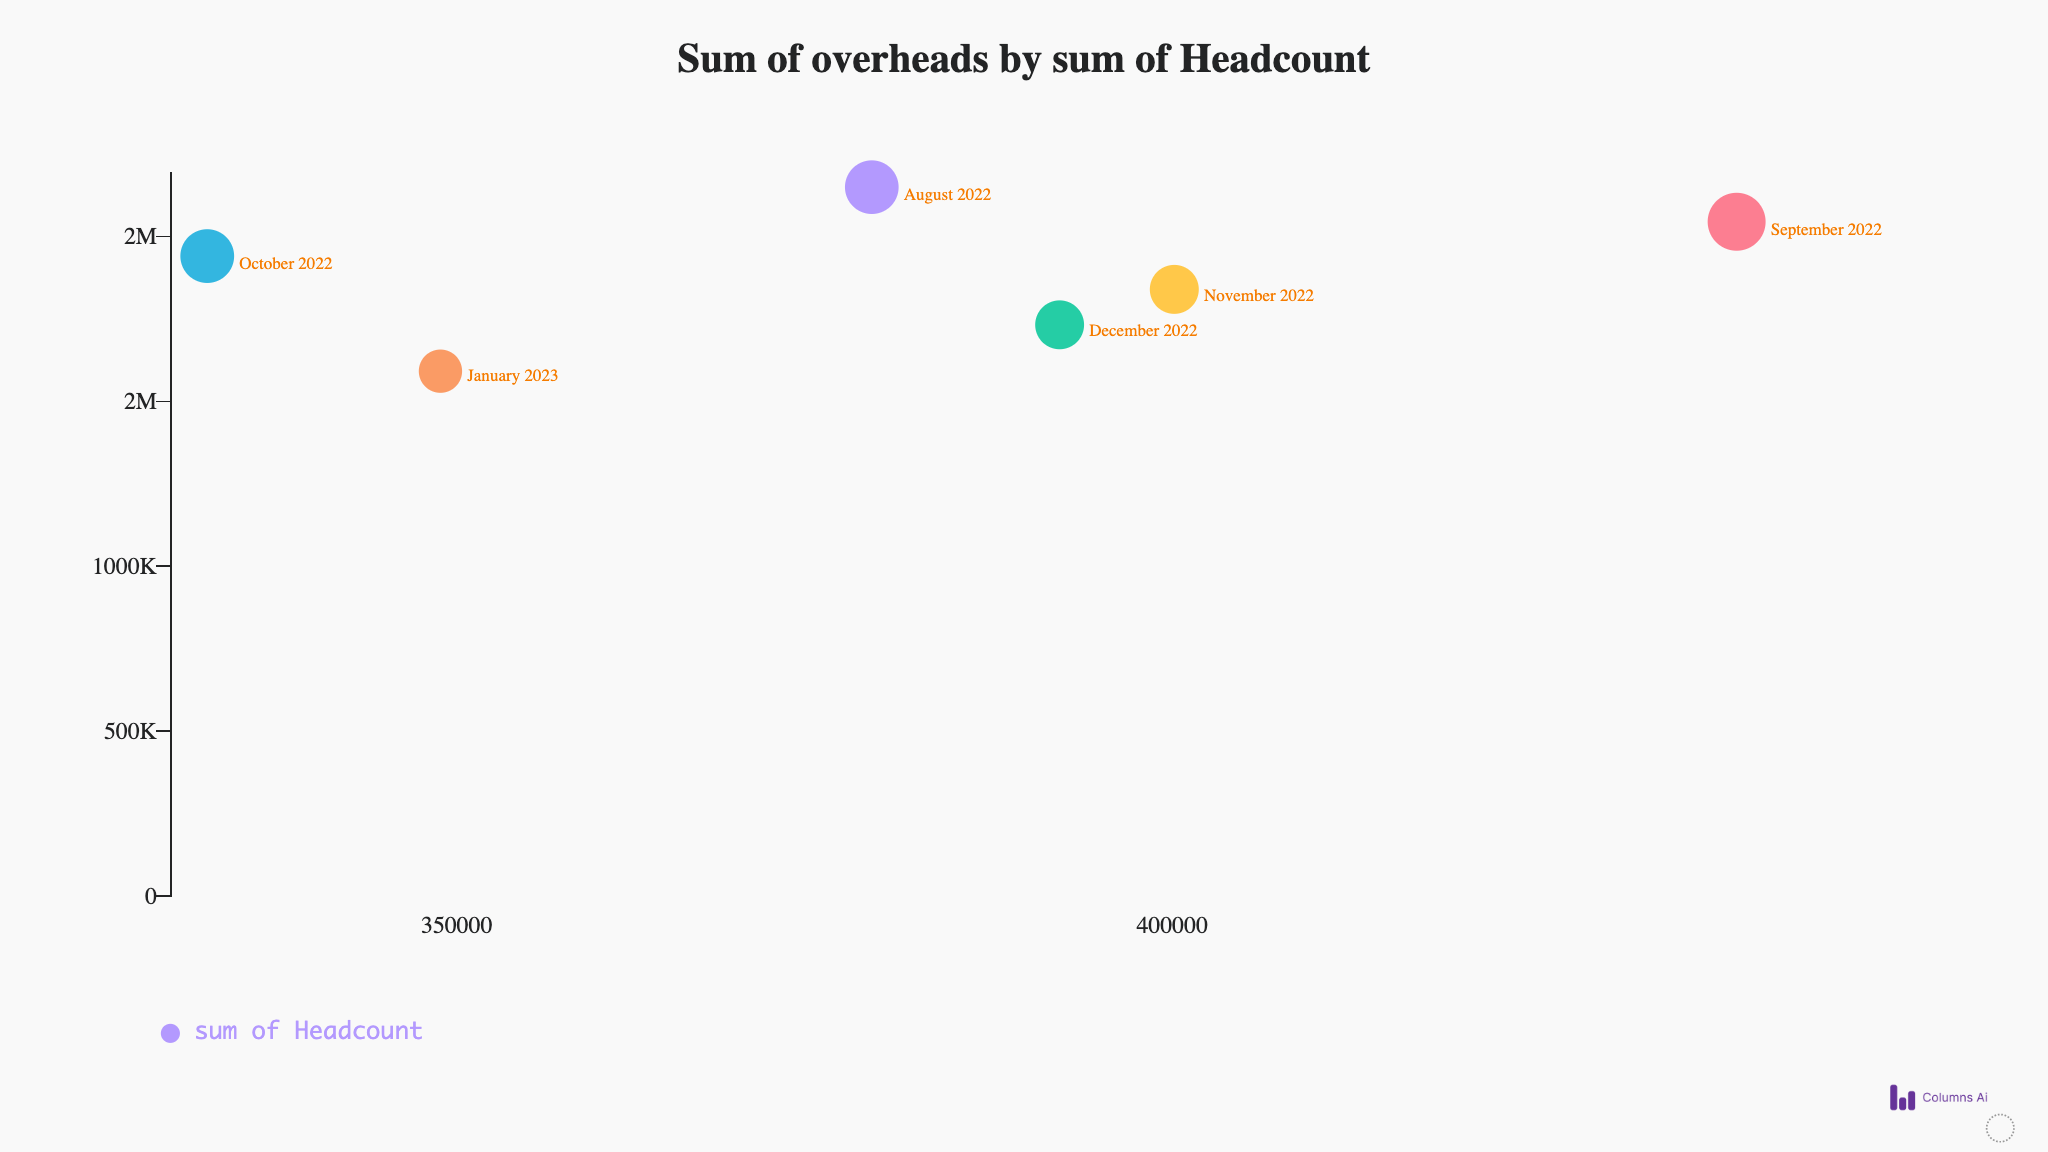
Example:
Scatter Anatomy
Reference layout: