Arrow
Arrows are a powerful visual tool for storytelling. After placing an arrow on the canvas, you can drag either end to reposition it.
Arrow settings let you customize:
- line style (solid or dashed)
- line thickness
- arrow heads and head shapes
- color
Shadow
You can also highlight horizontal or vertical regions using the Shadow option.
Label
Arrows support labels so you can explain specific data points. In label settings, you can customize background, title, and wrapped text content.
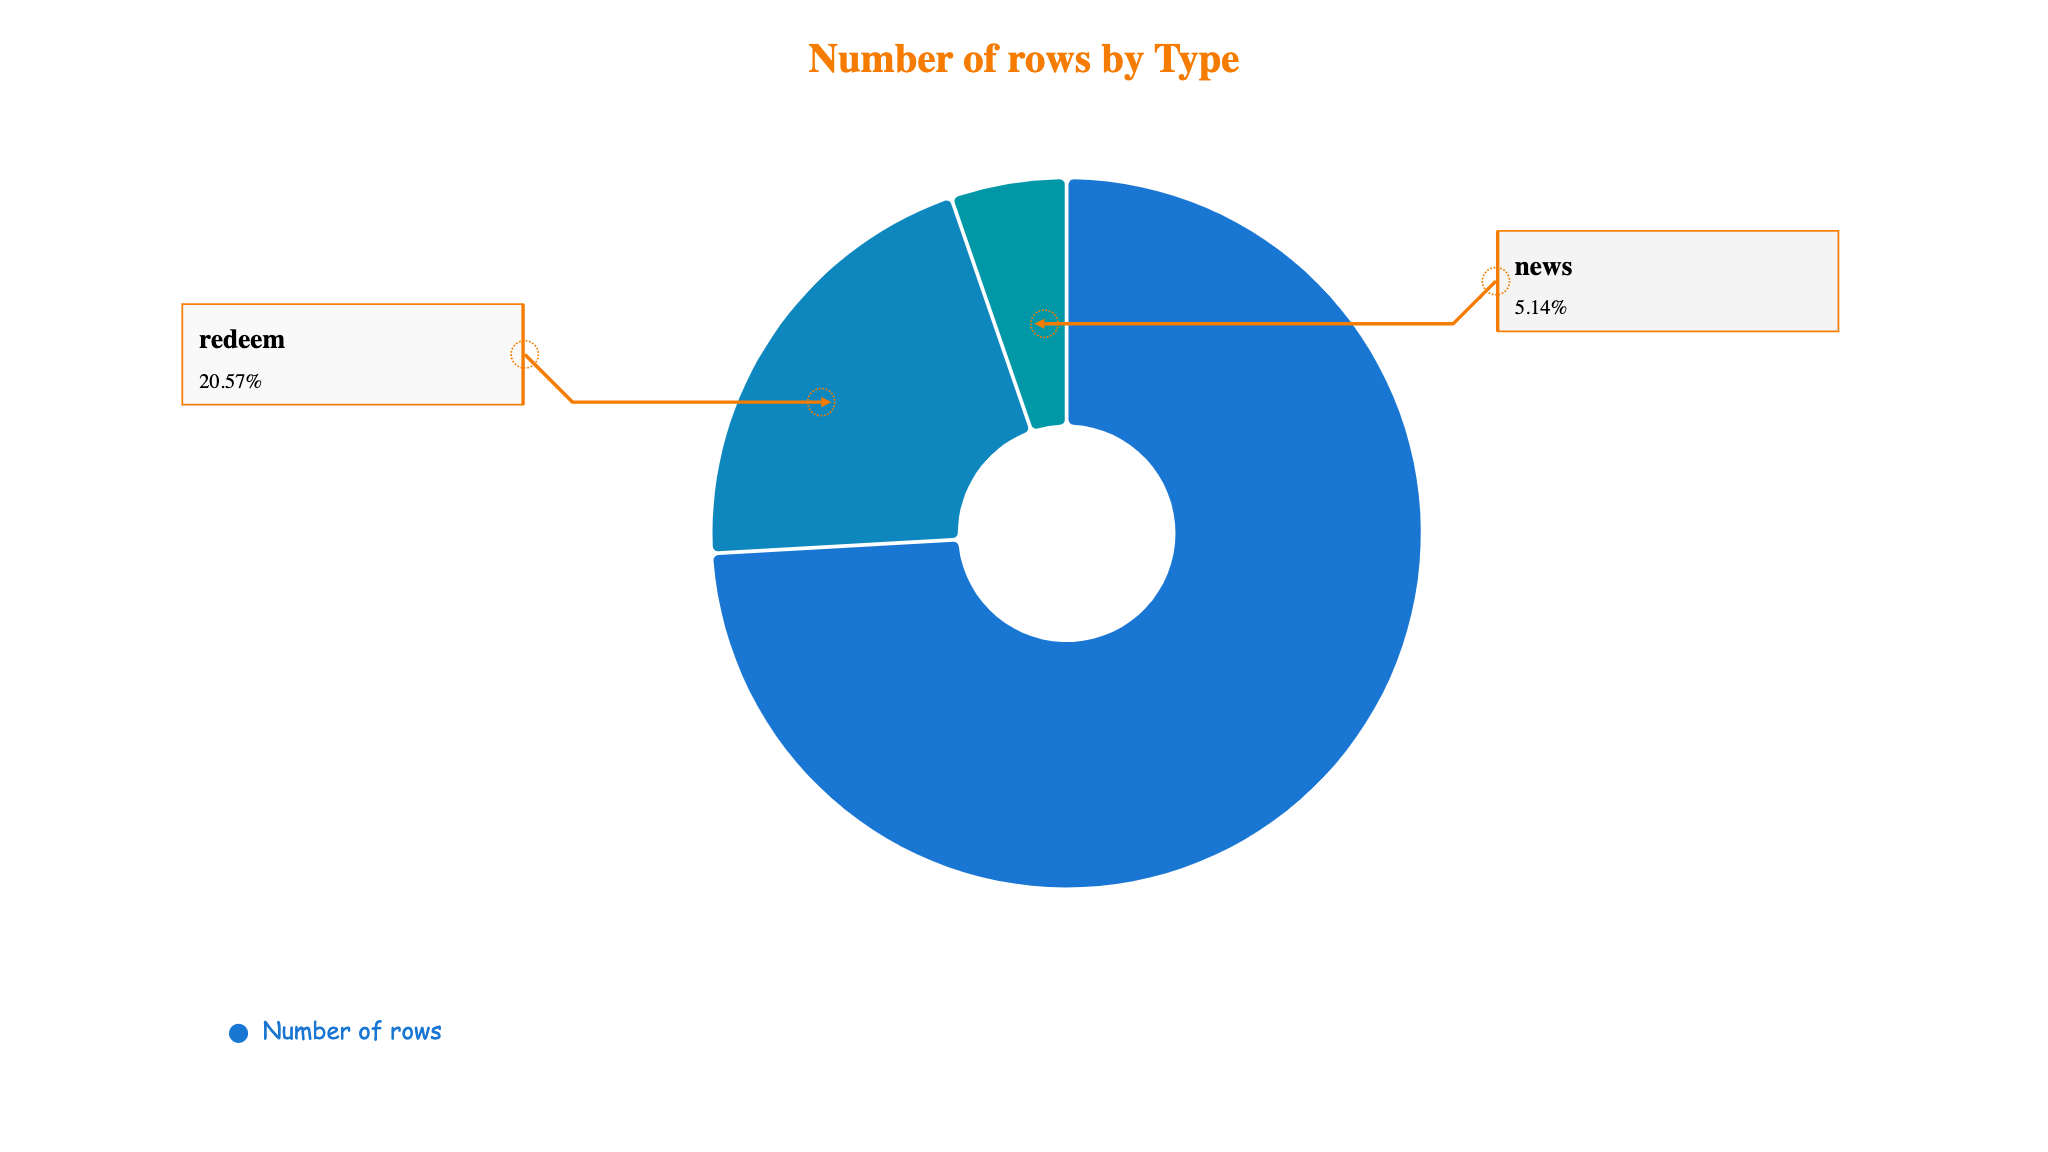
Marker
Marker is a specialized arrow mode for pointing to specific data points.
Auto Label automatically fills label values when you drag an endpoint onto supported chart areas.
Currently, Auto Label works for Line/Area and Pie charts.
Example: